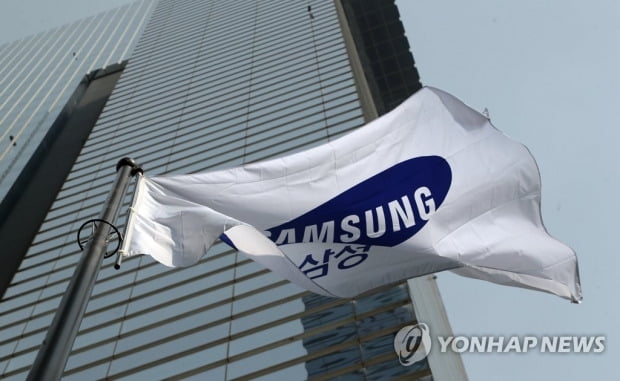
200 trillion won this year alone, an increase of 157 trillion won in two months after Lee Kun-hee passed away

The total market capitalization of Samsung Group stocks listed on the domestic stock market exceeded 700 trillion won for the first time ever.
This year alone, it increased more than 200 trillion won.
According to the financial investment industry on the 27th, the market cap of 23 Samsung Group stocks (including preferred stocks) listed on the KOSPI and KOSDAQ markets as of the 24th was 719.130 billion won.
This is the first time that the total market cap of a group in Korea has exceeded 700 trillion won.
The market cap of Samsung Group stocks is 1.3 times the total budget of Korea (556 trillion won) next year.
It is four times higher than SK (171 trillion 26 billion won), the second-largest group stock market cap.
As of the end of last year, the market cap of Samsung Group stocks (514 trillion 1112 billion won) was similar to the Korean budget for this year (512 trillion won, excluding extra budget), but the current market cap exceeded next year’s budget a year later.
Compared to the end of last year, 39.9% (205 trillion 18 billion won), and more than 200 trillion won this year alone.
The panic of the novel coronavirus infection (Corona 19) increased by 88.0% (336.53 trillion won) from March 19 (382,596 billion won), when the KOSPI index hit the bottom this year.
In particular, after the death of Chairman Lee Kun-hee on October 25 (56.84 trillion won), it surged by 28.0% (157 trillion 36 trillion won) in just two months.
[표] Total market capitalization of Samsung Group stocks by major branch over the past year
(Unit: KRW billion)
┌───────┬───────┬───────┬──────┬──────┐
│ Category │ 20-12-24 │ 20-10-23 │ 20-03-19 │ 19-12-30 │
├——–┼——–┼——-
│ Market cap │ 719,130 │ 561,814 │ 382,596 │ 514,112 │
├——–┼——–┼———-┼——–┼——–┤
│ Growth rate (%) │-│ 28.0 │ 88.0 │ 39.9 │
└───────┴───────┴───────┴──────┴──────┘
This is because the share prices of leading stocks, including Samsung Electronics, have risen sharply as the semiconductor industry improved and dividend expectations matched.
Accordingly, the share of KOSPI’s total market capitalization increased by 2.3 percentage points from 34.8% at the end of last year to 37.1%.
The combined market capitalization of Samsung Electronics (464 trillion 4490 billion won) and Samsung Electronics preferred stocks (59.96 trillion won) exceeded 500 trillion won.
Of the group stocks, 13 stocks gained market capitalization from the end of last year, while 10 stocks declined.
The market cap of preferred stocks has increased significantly.
Samsung Heavy Industries Woo (467.8%) had the highest growth rate, Samsung SDI Woo (207.7%), Samsung Electric Woo (78.4%), and Samsung C&T B[02826K](69.0%), Samsung Electronics Woo (60.4%), and Hotel Shinlau (50.5%) also showed high growth rates.
Among common stocks, Samsung SDI (138.6%), Samsung Biologics (83.4%), Samsung Electronics (39.4%), Samsung Electro-Mechanics (34.0%), and Samsung C&T (26.2%) were in order.
On the other hand, Samsung Engineering (-31.8%), Samsung Fire & Marine Insurance (-19.7%), Cheil Worldwide (-11.6%), and Hotel Shilla (-10.9%) declined in size.
[표] Market capitalization increase/decrease rate by item of Samsung group stock
(In millions of Korean won)
┌───────────┬────────┬───────┬───────┐
│ Stock │ 2020-12-24 │ 2019-12-30 │ Increase/decrease rate (%) │
├—————-┼———-┼——–┼——–┤
│ Samsung Fire & Marine Insurance │ 9,261,781│ 11,535,773│-19.7│
├—————-┼———-┼——–┼——–┤
│ Samsung F&M │ 497,952│ 529,872│-6.0│
├—————-┼———-┼——–┼——–┤
│ Samsung Electronics │ 464,449,082│ 333,113,866│ 39.4│
├—————-┼———-┼——–┼——–┤
│ Samsung Electronics Woo │ 59,906,152│ 37,359,056│ 60.4│
├—————-┼———-┼——–┼——–┤
│ Samsung SDI │ 38,714,430│ 16,228,429│ 138.6│
├—————-┼———-┼——–
│ Samsung SDI Woo │ 459,482│ 149,332│ 207.7│
├—————-┼———-┼——–┼——–┤
│ Hotel Shilla │ 3,175,173│ 3,563,729│-10.9│
├—————-┼———-┼——–
│ Hotel Shilla │ 59,850│ 39,774│ 50.5│
├—————-┼———-┼——–┼——–┤
│ Samsung Electro-Mechanics │ 12,511,194│ 9,336,712│ 34.0│
├—————-┼———-┼——–┼——–┤
│ Samsung Electro-Woo │ 259,303│ 145,349│ 78.4│
├—————-┼———-┼——–┼——–┤
│ Samsung Heavy Industries │ 4,365,900│ 4,580,100│-4.7│
├—————-┼———-┼——–┼——–┤
│ Samsung Heavy Industries │ 40,885│ 7,201│ 467.8│
├—————-┼———-┼——–┼——–┤
│ S-One │ 3,256,530│ 3,560,523│-8.5│
├—————-┼———-┼——–┼——–┤
│ Samsung Securities │ 3,835,435│ 3,446,980│ 11.3│
├—————-┼———-┼——–┼——–┤
│Samsung SDS│ 13,889,315│ 15,049,982│-7.7│
├—————-┼———-┼——–┼——–┤
│ Samsung Engineering │ 2,567,600│ 3,763,200│-31.8│
├—————-┼———-┼——–┼——–┤
│ Samsung C&T │ 25,977,304│ 20,581,370│ 26.2│
├—————-┼———-┼——–┼——–┤
│ Samsung C&T Woo B │ 214,006│ 126,615│ 69.0│
├—————-┼———-┼——–┼——–┤
│ Samsung Card │ 4,084,026│ 4,472,153│-8.7│
├—————-┼———-┼——–┼——–┤
│ Cheil Worldwide │ 2,444,626│ 2,766,741│-11.6│
├—————-┼———-┼——–┼——–┤
│ Samsung Life Insurance │ 16,420,000│ 14,900,000│ 10.2│
├—————-┼———-┼——–
│ Multi-campus │ 204,474│ 205,363│-0.4│
├—————-┼———-┼——–┼——–┤
│ Samsung Biologics │ 52,535,010│ 28,649,445│ 83.4│
├—————-┼———-┼——–┼——–┤
│ Total │ 719,129,510│ 514,111,565│ 39.9│
└───────────┴────────┴───────┴───────┘
/yunhap news
